
Tracking your net worth answers “where am I.” This release is about the next two questions: “where is this going” and “is my portfolio actually set up to get there.” NetTrack 1.6.14 adds a retirement planner that solves for your financial independence date, an allocation view that turns a target mix into buy and sell amounts, and a fee analyzer that puts a dollar figure on what your funds charge. Here’s what’s new.
Plan: your FI number and the year you reach it
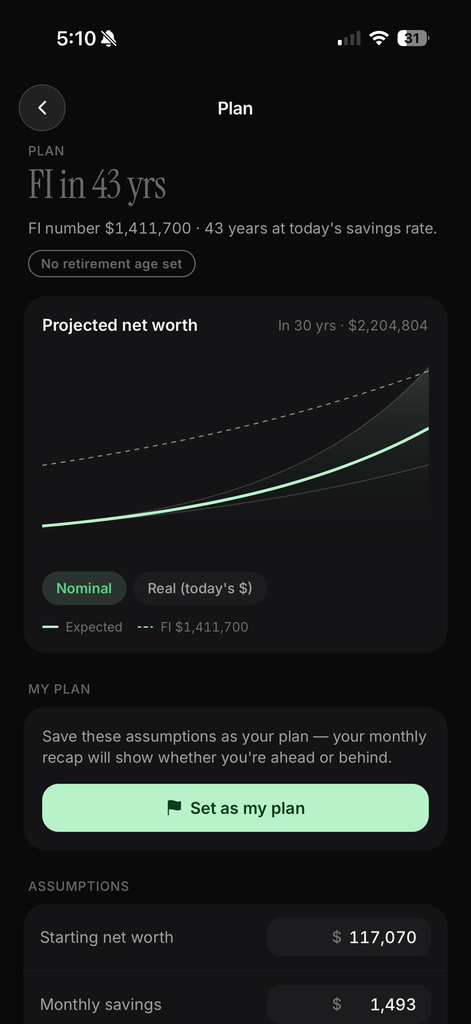
The old Scenarios screen let you project your net worth forward. It’s now called Plan, and it answers a sharper question: when can you stop working?
Enter what you’d spend in a year of retirement and Plan computes your FI number, the portfolio that funds that spending at your chosen withdrawal rate (4% by default). Then it runs your current net worth and monthly savings forward and tells you the year you cross it. The verdict sits at the top of the screen in plain language: “FI in 43 yrs,” “On track: FI at 58,” or “Short: FI at 63 at this pace.”
The projection chart now draws the FI number as a dashed line, so you can see the gap close. Toggle between Nominal and Real (today’s $) to see the same path with inflation stripped out. A shaded band around the expected line shows the optimistic and pessimistic cases, two points of return either side of your assumption.
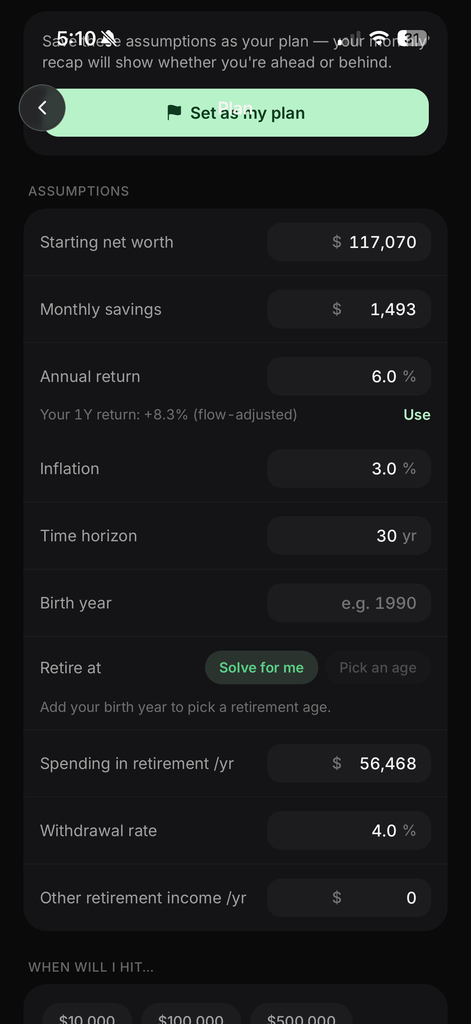
Every input is editable, and the defaults come from your data rather than a textbook:
- Starting net worth and monthly savings are pulled from your accounts and your actual savings rate.
- Annual return shows your own flow-adjusted 1-year return next to the field, with a one-tap Use to plug it in.
- Spending in retirement starts from what you spend today.
- Other retirement income covers a pension, Social Security, or rental income, and reduces the portfolio you need.
Pick an age, and Plan tells you what it takes
Add your birth year and you can switch Retire at from “Solve for me” to a specific age. If your current pace gets you there, Plan says so and by how many years to spare. If it doesn’t, it solves the other direction: “Save $410 more a month to retire at 60.” That single number is the whole point of a planner, and most of them make you find it by trial and error.
Past your retirement age the projection flips from contributing to withdrawing. Your chosen spending comes out each year, adjusted for inflation, and the chart keeps going so you can see whether the money lasts. If the pessimistic case runs out, the verdict tells you the age it happens.
Set it as your plan
Tap Set as my plan and the assumptions you’ve dialed in become your saved plan. From then on your monthly recap checks your real net worth against the plan’s expected path and reports “On plan,” “$2,300 ahead of plan,” or “$1,100 behind plan,” along with roughly how many months ahead or behind you’re running. The Plan tile on the Cash Flow tab shows the same verdict, computed the same way, so the two never disagree.
Below the assumptions, When will I hit gives quick answers for $10,000, $100,000, $500,000, $1,000,000, or any target you type.
Plan is a Premium feature.
Allocation: from “what do I own” to “what should I move”
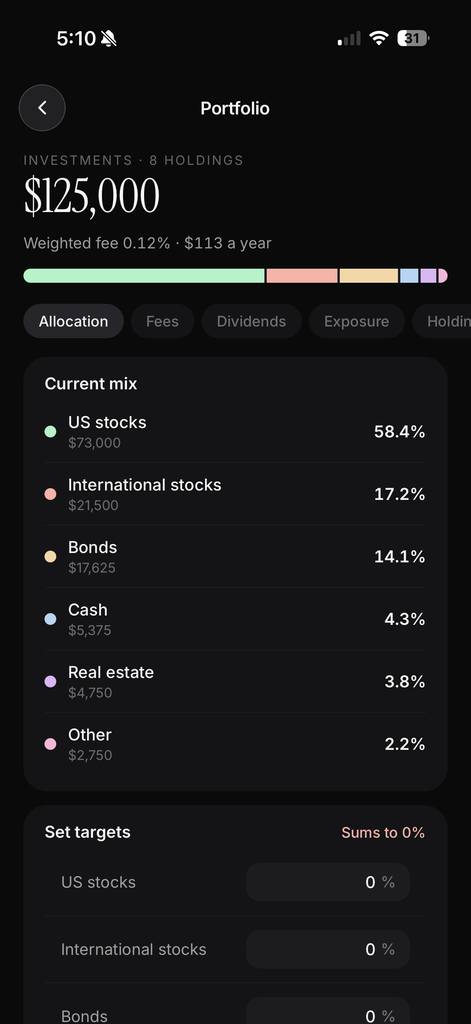
The Portfolio screen’s Allocation tab now classifies every holding into six buckets: US stocks, international stocks, bonds, cash, real estate, and other. A single-stock position is easy. A fund is not, so NetTrack looks through it. A total-market ETF is counted as US stocks, a global fund is split between US and international by its actual country mix, and a balanced fund is divided between stocks and bonds by what it holds. Tap any class to see the holdings behind it and how much of each one landed there, so you can check the classification rather than trust it.
Then set your targets. Enter the mix you want, and the tab switches from “Current mix” to Mix vs target, showing the drift for each class in percentage points and the amount to move: “Buy $4,200” of bonds, “Sell $1,900” of US stocks, or “On target” when you’re within two points. Targets are saved to your account, so the next time you open Portfolio the drift is already computed against them.
Fees: what your funds actually cost
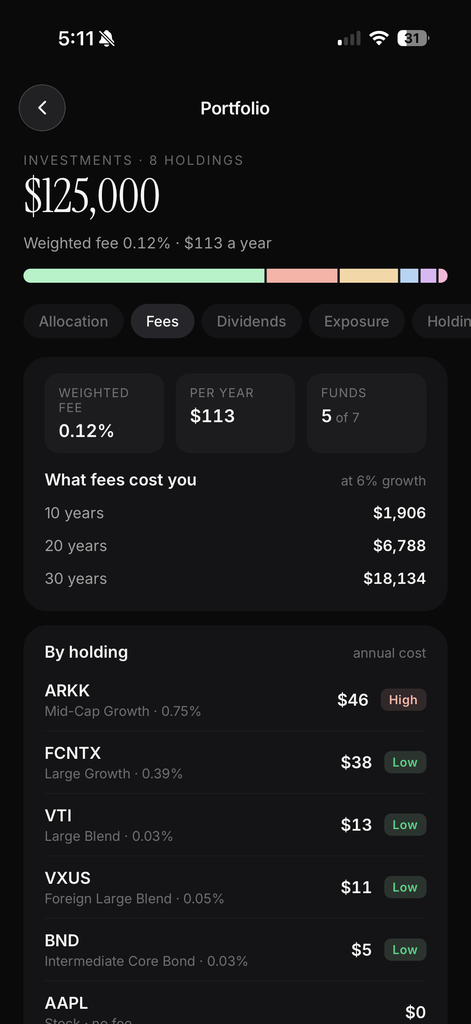
The Fees tab turns expense ratios into money. At the top: your portfolio’s weighted fee, what that comes to per year, and how many of your holdings are funds with a published expense ratio. Below that, What fees cost you projects the drag over 10, 20, and 30 years at your assumed growth rate. A portfolio with a 0.12% weighted fee looks nearly free until you see it’s $18,000 over 30 years, and a 0.75% one is several times that.
Every fund gets its own row with its Morningstar category, expense ratio, and annual cost in dollars, sorted by what it costs you. Anything over 0.5% is flagged High. Individual stocks show as no fee, so the list separates the funds worth a second look from everything else. The same fund held in two accounts is one row.
The weighted fee and allocation bar also appear in the Portfolio header, so both are one glance away from the Investments tab.
Also in this release
- Dividends moved from the Investments tab to the Portfolio analytics screen, alongside Fees and Exposure, and the Investments row got a single Analytics entry point.
- Exposure totals are now currency-converted, so the Allocation, Exposure, and Holdings tabs all agree on your total.
- Savings rate history got the same 1M, 3M, YTD, 1Y, and All range pills as the Cash Flow tab.
Available now
NetTrack 1.6.14 is rolling out on the App Store and Google Play. Plan lives on the Cash Flow tab, and Allocation and Fees are on the Portfolio screen under Investments.
If your plan says “short,” that’s the number we want you to see before it’s too late to do anything about it. Tell us what you’d change.
Leave a Reply