Tag: investment tracking

  • The Average 401(k) Balance by Age in 2026 (And Why the Median Matters More)

    The Average 401(k) Balance by Age in 2026 (And Why the Median Matters More)

    The average American 401(k) balance is about $141,000 as of early 2026, according to Fidelity. Vanguard's numbers, covering 4.6 million accounts through year-end 2025, put the average at $167,970 — but the median is just $44,115. That gap is the most important fact in this article: the typical saver has far less than the "average" suggests, because a minority of large accounts pull the average up.

    Here's how balances break down by age and generation, and how to judge your own number.

    Average 401(k) balance by generation (Fidelity, Q1 2026)

    Generation Average 401(k) balance
    Baby Boomers $260,300
    Gen X $215,600
    Millennials $82,600
    Gen Z $18,000
    All savers $141,000

    Vanguard's How America Saves 2026 report adds the endpoints by age: workers under 25 average $7,259 (median $2,234), while those 65 and older average $330,186 (median $103,202). At every age, the median runs at roughly a quarter to a third of the average.

    One genuinely encouraging trend: the combined employee-plus-employer savings rate hit a record 14.4% in early 2026 — close to Fidelity's recommended 15%.

    Why the median is your benchmark

    Averages answer "how much money is in 401(k)s per person" — a fact about the system. Medians answer "how much does the typical person have" — a fact about people like you. When the average is $168,000 and the median is $44,000, comparing yourself to the average mostly measures how far you are from a small number of very large accounts.

    Am I on track? The salary-multiple test

    A better benchmark than other people's balances is your own salary. Fidelity's widely used guideline: 1× your salary saved by 30, 3× by 40, 6× by 50, 8× by 60, and 10× by 67 — across all retirement accounts, not just your current 401(k). We break this down with examples in How Much Should You Have Saved by 30, 40, and 50?

    Three things that move the number most

    1. Capture the full employer match. It's an immediate 50–100% return on those dollars; leaving it unclaimed is the most expensive common mistake.
    2. Raise your rate 1% per year. Going from 6% to 12% over six years is barely felt per paycheck but roughly doubles your lifetime contributions.
    3. Count every account. Old 401(k)s from previous jobs, IRAs, and HSAs are all part of the real picture — and orphaned accounts are where fees and forgotten cash-heavy allocations hide.

    That last one is where tracking tools earn their keep: your true retirement position is the sum of scattered accounts, which no single provider's dashboard shows you.

    Frequently asked questions

    What's a good 401(k) balance at 40?
    By Fidelity's guideline, about 3× your salary across retirement accounts — $240,000 for an $80,000 earner. The typical American at that age has meaningfully less, so "on the guideline" means comfortably ahead of the median.

    Why is my balance so far below the average for my age?
    Averages are inflated by high earners and long-tenured savers. Compare to the median, and more importantly, to the salary-multiple targets for your own income.

    Do these figures include IRAs?
    No — they're 401(k)-plan data from Fidelity and Vanguard. Your full retirement picture should add IRAs, HSAs, and old employer plans.

    Where does this data come from?
    Fidelity's quarterly retirement analysis (Q1 2026) and Vanguard's How America Saves 2026 report covering year-end 2025. Both update regularly, and we'll refresh this page as new quarters land.


    See all your retirement accounts — current 401(k), old ones, IRAs — in one place with NetTrack, including how they're actually performing. Start free.

  • Why Your Portfolio ‘Return’ Is Lying to You (Flow-Adjusted Returns, Explained)

    Why Your Portfolio ‘Return’ Is Lying to You (Flow-Adjusted Returns, Explained)

    Your brokerage balance was $50,000 last month. Today it's $53,000. Great month, right? +6%?

    Not if $2,500 of that was your own paycheck being deposited. Your investments actually earned $500 — about 1% — and the rest was just you moving your own money around. This is the single most common way people misread their portfolio performance, and most finance apps make it worse by charting raw balances.

    Here's how returns actually work, and how to see your real number.

    The problem: deposits look like gains

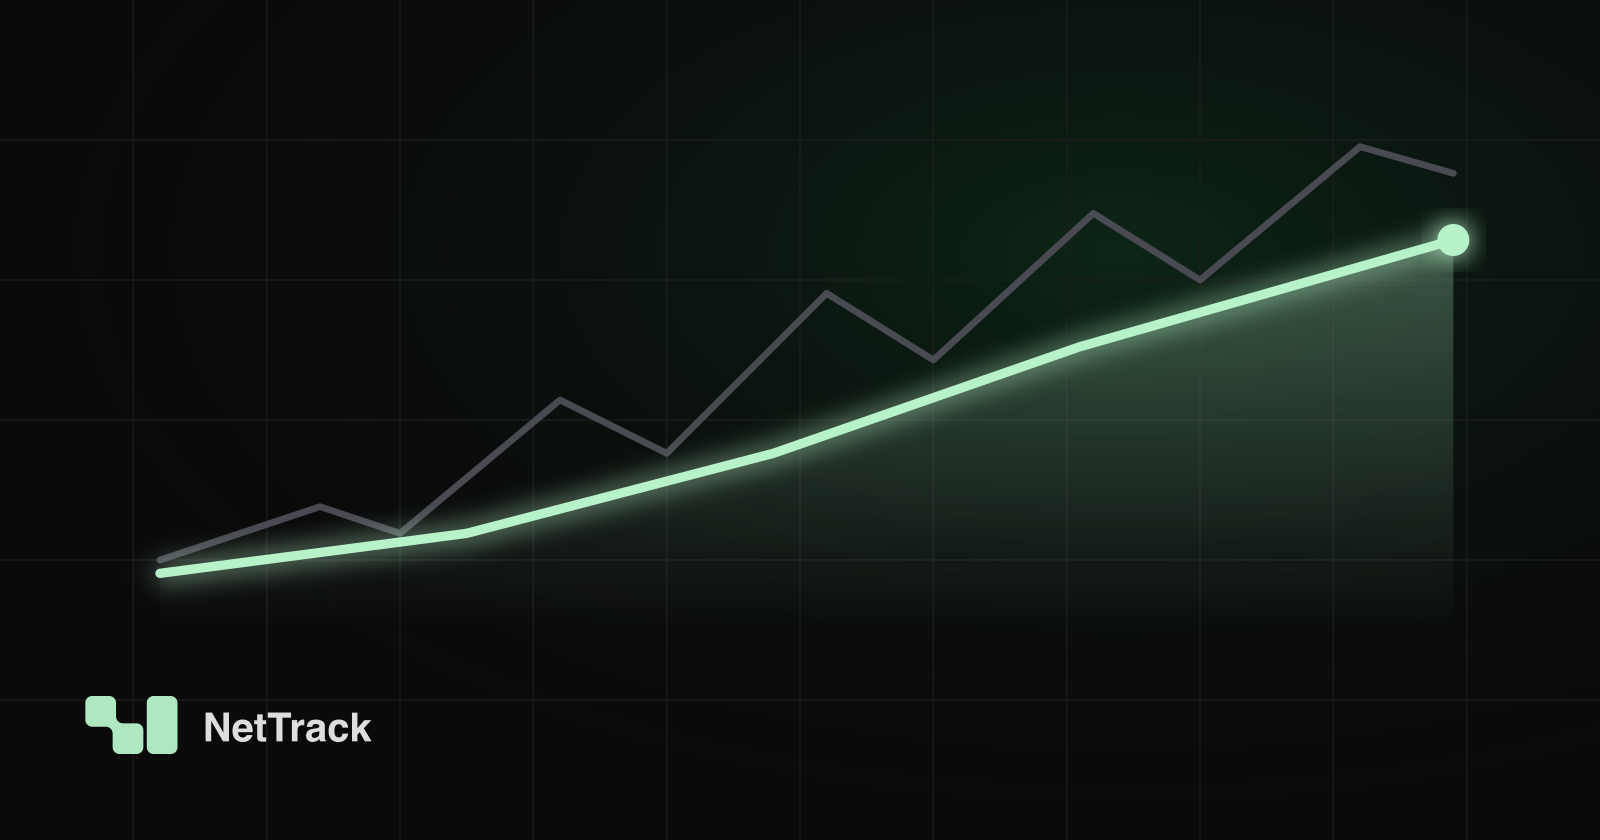
    A balance chart answers "how much money is in the account?" It cannot answer "how well are my investments performing?" — because every deposit pushes the line up and every withdrawal pushes it down, regardless of what the market did.

    The distortion is biggest for exactly the people trying hardest: if you're contributing $500 every two weeks to a 401(k), your balance chart will look fantastic even in a flat market. Conversely, retirees drawing down an account can have great investment performance that looks like steady decline.

    A return is only meaningful if it's adjusted for cash flows — deposits and withdrawals stripped out, so what's left is actual performance.

    The fix: flow-adjusted returns

    The idea is simple:

    Investment gain = (ending balance − starting balance) − net deposits

    In the example above: ($53,000 − $50,000) − $2,500 = $500 of real gain, on roughly $50,000 of invested money ≈ 1%, not 6%.

    Finance professionals formalize this in two ways:

    Money-weighted return (MWR)

    The return your money actually experienced, accounting for when each deposit and withdrawal happened. A deposit made right before a rally boosts your MWR; one made right before a dip drags it down. This is the honest answer to "how did I do?"

    Time-weighted return (TWR)

    The return of the strategy, with the effect of cash-flow timing removed entirely. Fund managers report TWR because they don't control when clients add or remove money. It answers "how did the investments do?" — useful for comparing against the S&P 500, less personal.

    For individual investors tracking their own progress, money-weighted (flow-adjusted) return is the number that matters: it reflects your actual dollars, your actual timing, your actual outcome.

    A worked example

    Say you start January with $10,000, deposit $1,000 on the 15th, and end the month at $11,300.

    • Naive read: $10,000 → $11,300 = "+13%". Wrong.
    • Flow-adjusted: gain = ($11,300 − $10,000) − $1,000 = $300. Your money earned roughly 3% — a good month, but a very different number than 13%.

    Compound that mistake over years of steady contributions and you can convince yourself you're a great investor while underperforming a savings account.

    Why most apps get this wrong

    Computing flow-adjusted returns requires transaction-level data — every deposit, withdrawal, dividend, and transfer, per account — not just daily balances. Many net worth apps only pull balances, so a balance chart is all they can show. Others mix methods across screens, so the "return" on one page doesn't match another.

    NetTrack computes a flow-adjusted return for every investment account, and your portfolio return is built from those same per-account numbers — one method, one basis, everywhere in the app. Deposits, withdrawals, and transfers between your own accounts never masquerade as performance. Dividends are tracked and counted as the returns they are.

    How to check your own numbers

    1. Pick one account and one month.
    2. Write down the starting balance, ending balance, and every deposit/withdrawal in between.
    3. Compute: (end − start) − net deposits = true gain.
    4. Compare that to what your app is showing you.

    If your app's "return" moves every time you contribute, it's showing you a balance chart with a percent sign on it.

    Frequently asked questions

    What is a flow-adjusted return?
    A return calculated after removing the effect of deposits and withdrawals, so it reflects only investment performance. Money-weighted return is the standard formalization.

    Should I use time-weighted or money-weighted return?
    Money-weighted for tracking your own progress (it's what your dollars actually earned). Time-weighted for judging a strategy or comparing a manager to a benchmark.

    Do dividends count as gains?
    Yes — dividends are investment income and belong in your return. But a transfer of your own cash into the account does not. Good tracking distinguishes the two.

    Why does my 401(k) provider show a different return than my balance growth?
    Because your provider (correctly) adjusts for your contributions. The balance grew from both contributions and returns; the reported return strips contributions out.


    Want to see how your portfolio is actually performing? NetTrack computes flow-adjusted returns for every account, automatically. Try it free.